|
A New View of Statistics |
|
I've already discussed this model somewhat on the previous page, so read that first if you've browsed straight onto this page. Let's get straight onto the ways the model can be used and interpreted.
Main-Effects Model
The
effect of the nominal variable sex in the model is simply to add a constant
amount for boys and a different constant amount for girls. That's what a nominal
effect does in an ANOVA or t test, and the same is
true here. The effect of height is to make the usual straight-line relationship.
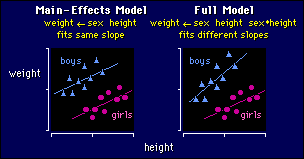
Put the two together and you have parallel straight lines for the two groups,
as shown above left. The separation of the straight lines is the sex effect,
and the slope of the straight lines is the height effect. If there are three
groups, there are three parallel straight lines, and you'll want to do pairwise
comparisons on the separations of the lines by doing estimates
or contrasts for the sex effect.
Full Model
The full model is appropriate when different
slopes are apparent, as on the right in the above figure. Interpreting the height
effect here is easy: it's just the overall slope for both groups taken together,
when you have accounted for any difference between the slopes. The difference
between the slopes is given by the interaction effect. How come? The easiest
way to see it is again to think about sex representing two numbers: one for
the boys and one for the girls. When you multiply the height part of the interaction
term by a number that is different for the boys and the girls, you get a different
slope for the boys and the girls.
Now, you have to be very careful interpreting the meaning of the main effect
sex in the full model. It refers strictly to the intercepts of the straight
lines where they cross the Y (weight) axis, in other words where X (height)
is zero. The difference between these intercepts is what you get if you dial
up the estimate or contrast for the difference between the sexes, but that's
not usually what people are interested in. They're much more interested in the
separation of the lines somewhere around the middle value for height, because
that's where you think about whether the boys are different from the girls.
Getting it is not a problem in the main-effects model, because the lines are
parallel, so the solution for sex in the model or the estimate of the difference
works OK. But the full model gives us a real headache when we ask the question
of just how different the boys are from the girls overall. The sex effect does
not tell us! Sigh... What does, then?
Least-Squares Means
 T
here are two solutions to this problem, both difficult to explain. If
your stats program is advanced enough, get it to output the least-squares
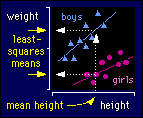
means for sex. Least-squares means for a nominal effect like sex are the
predicted values of the dependent variable (weight) for each level of the effect
when all other effects (height) are set to their mean values. And that's probably
what you want: the values of height in the middle of the weights. The figure
should make it clear. (By the way, the term least-squares means comes
from the fact that these means are estimated from a model that is fitted by
the least-squares method.) If your stats program is really cool, it will do
estimates and contrasts between the least-squares
means for the different levels of sex, and give you confidence intervals and
p values.
In the second solution, you get your stats program to generate the estimate or contrast for the difference between the boys and girls for a chosen height. It won't be easy, and it may not even be possible with your stats program. This long-handed method is better than using least-squares means, because you can ask how different boys are from girls for any height, not just the mean height.
Doing estimates and tests is so much easier when you don't have that cursed interaction term! Even if there is a bit of a difference in slopes, there's a good case for keeping only main effects in the model to estimate/test the differences between levels of the effects.
When Effects Become Substantial
Two more things to watch for in ANCOVA, and
in any model with two or more effects, for that matter. The first is that adding
a term into a model can make a previously non-substantial (or non-significant)
term substantial (significant). Here's an example to show it:
Without sex in the model, the relationship between height and weight seems
random. Label the points for sex, and there is obviously an effect of height
on weight. Cool!
When Effects Become Insubstantial
So, if you can make something significant
by adding a term, is there a situation where an effect is significant on its
own, but becomes non-significant when you add another effect to the model?
Yes. Here's an example:
If you didn't know the heights of the boys and girls, you would conclude that there was a difference in weight (left-hand side). Add heights in, and it's clear that you can draw the same straight line through the boys and the girls (right-hand side). There is no separation between the lines drawn through either set of points, so there is no effect of sex! Help, what's going on?!
It's all a question of interpretation. Obviously there is a difference between the heights of girls and boys, but not when you take height into account. Or to put it another way, there's no difference between boys and girls in weight-for-height. Not with these data anyway. Whether there is in reality is another matter.
You can also get the situation in ANCOVA and other complex models where two or more effects are significant on their own, but neither is significant in the presence of the others! I give an example on the next page.
The moral of these two stories is plain: look at your data and
see what's going on before you do any statistical modeling. A
model is only a formal quantitative way of describing your informal
qualitative impression.
Go to: Next
· Previous
· Contents ·
Search
· Home
webmaster
Last updated 11 Dec 00