|
A New View of Statistics | |

/*
Simple repeated measures, one within-subject effect (test),
with four levels.
First analysis makes and analyzes raw data.
Second analysis makes new data set with variations and changes
in percents, which require log transformation before analysis.
*/

options linesize=78;
options pagesize=30;

/*
First analysis.
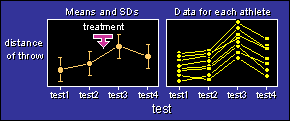
Generates data for 20 athletes with:
   true mean=60, between SD=8 (excluding within SD), within SD=3.
The mean increases by 0.4 at each retest, to simulate a learning effect.
An experimental effect of 2.0 is added in the third test.
Try 200 athletes if you want to see these effects clearly.
*/

data dat1;
do athlete=1 to 20;
  true=60+8*rannor(0);
  dist1=true+3*rannor(0);
  dist2=true+0.4+3*rannor(0);
  dist3=true+0.8+2+3*rannor(0);
  dist4=true+1.2+3*rannor(0);
  output;
end;
run;


*checks means and SDs of data;
proc means n mean std maxdec=1;
var true dist1-dist4;
run;


*Converts data to the form proc mixed uses;
data;
set dat1;
distance=dist1; test=1; output;
distance=dist2; test=2; output;
distance=dist3; test=3; output;
distance=dist4; test=4; output;
drop true dist1-dist4;

*first time through, check the correlation and covariance matrices
for lack of compound symmetry;
proc mixed;
class athlete test;
model distance=test;
repeated test/subject=athlete r rcorr type=un;
title "Analysis of untransformed data";
title2 "First pass, with unstructured covariance matrix";
run;


*second time through, using compound symmetry;
proc mixed covtest cl;
class athlete test;
model distance=test;
repeated test/subject=athlete r rcorr type=cs;
lsmeans test;
estimate 'test 2 - 1' test -1 1 0 0 /cl;
estimate 'test 3 - 2' test 0 -1 1 0 /cl;
estimate 'test 4 - 3' test 0 0 -1 1 /cl;
estimate 'test 3 - 2&4' test 0 -0.5 1 -0.5 /cl;
title "Analysis of untransformed data";
title2 "Second pass, with compound symmetry";
run;


/*
Generates 20 athletes with:
  true mean=60, between SD=13% (excluding within SD), within SD=4%.
The mean increases by 0.7% at each retest, to simulate a learning effect.
Experimental effect of 3.5% is added in the third test.
Try 200 athletes if you want to see these effects clearly.

The least-squares means in proc mixed are now for log(distance).
Back-transform (exp(whatever)) to make sense of them.
*/

data dat1;
do athlete=1 to 20;
  true=60*exp(0.13*rannor(0));
  dist1=true*exp(0.04*rannor(0));
  dist2=true*exp(0.007+0.04*rannor(0));
  dist3=true*exp(0.014+0.035+0.04*rannor(0));
  dist4=true*exp(0.021+0.04*rannor(0));
  output;
end;
run;


*checks means and SDs of data;
proc means n mean std maxdec=1;
var true dist1-dist4;
run;


*Converts data to the form proc mixed uses;
*and takes logs to get SDs and outcomes as percents;
data;
set dat1;
distance=log(dist1); test=1; output;
distance=log(dist2); test=2; output;
distance=log(dist3); test=3; output;
distance=log(dist4); test=4; output;
drop true dist1-dist4;

*first pass;
proc mixed;
class athlete test;
model distance=test;
repeated test/subject=athlete r rcorr type=un;
title "Analysis of log-transformed data";
title2 "Multiply estimates and SDs by 100 to get percents";
run;

*second pass;
proc mixed covtest cl;
class athlete test;
model distance=test;
repeated test/subject=athlete r rcorr type=cs;
lsmeans test; *note: these are for log(distance);
estimate 'test 2 - 1' test -1 1 0 0 /cl;
estimate 'test 3 - 2' test 0 -1 1 0 /cl;
estimate 'test 4 - 3' test 0 0 -1 1 /cl;
estimate 'test 3 - 2&4' test 0 -0.5 1 -0.5 /cl;
title "Analysis of log-transformed data";
title2 "Multiply estimates and SDs by 100 to get percents";
run;
Go to: Previous · Contents · Search
· Home
resources=AT=sportsci.org · webmaster=AT=sportsci.org · Sportsci Homepage · Copyright
©1997
Last updated 13 May 98